Lesson 10: Performance Monitoring - Building Production-Ready Observability

The Problem: Flying Blind in Production
You've built an amazing Twitter clone with media uploads and real-time features. Users love it. But suddenly, tweets take forever to load, image uploads fail randomly, and you have no clue what's breaking. Welcome to every developer's nightmare: running a production system without monitoring.
Instagram faced this exact scenario when celebrity posts overwhelmed their servers. Netflix crashed during major movie premieres. Twitter's infamous "fail whale" appeared when they couldn't see system overload coming. The companies that survived learned one crucial lesson: you can't fix what you can't see.
Today we're building the monitoring stack that prevents these disasters. By lesson's end, you'll have real-time dashboards, intelligent alerts, and the ability to trace every request through your system.
What We're Building Today
We're implementing a comprehensive monitoring stack that watches every heartbeat of our application. We'll set up Prometheus for metrics collection, create beautiful Grafana dashboards, implement distributed tracing, and build intelligent alerting that knows when something's wrong before your users do.
Our Target: Monitor 1,000 concurrent users with real-time visibility into every component of our system.
Why Monitoring Is Your Production Lifeline
Think about flying a plane without instruments - that's running production systems without monitoring. When Instagram's servers start struggling under viral content, they know within seconds because their monitoring stack screams before users notice lag.
Monitoring isn't just about collecting data - it's about turning system behavior into actionable intelligence. The difference between a system that scales gracefully and one that crashes spectacularly often comes down to knowing what's happening inside your black box.
Core Concepts: The Three Pillars of Observability
1. Metrics - The Vital Signs
Metrics are numerical measurements collected over time. Your CPU usage, memory consumption, request latency, and error rates are all metrics. They answer "What is happening?" but not "Why?"
2. Logs - The Detailed Story
Logs capture discrete events with context. When a user fails to post a tweet, logs tell you exactly what went wrong, with stack traces and user context.
3. Traces - The Journey Map
Distributed tracing follows a single request across multiple services, showing you the complete journey from API call to database write to cache update.
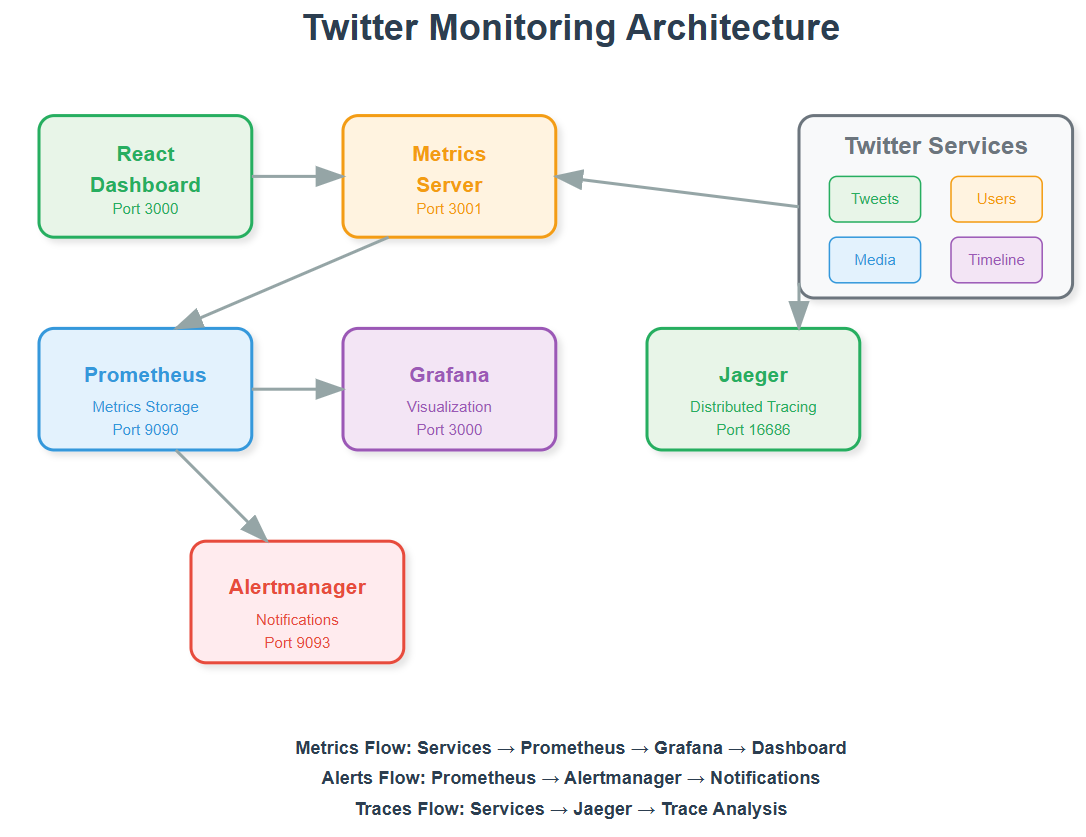
Architecture: Building Our Monitoring Nervous System
Our monitoring architecture creates a comprehensive observability layer that watches every component of our Twitter system without impacting performance.