Lesson 12 — Stepping Through Time: Building the Event Debug Interface

What We’re Building Today
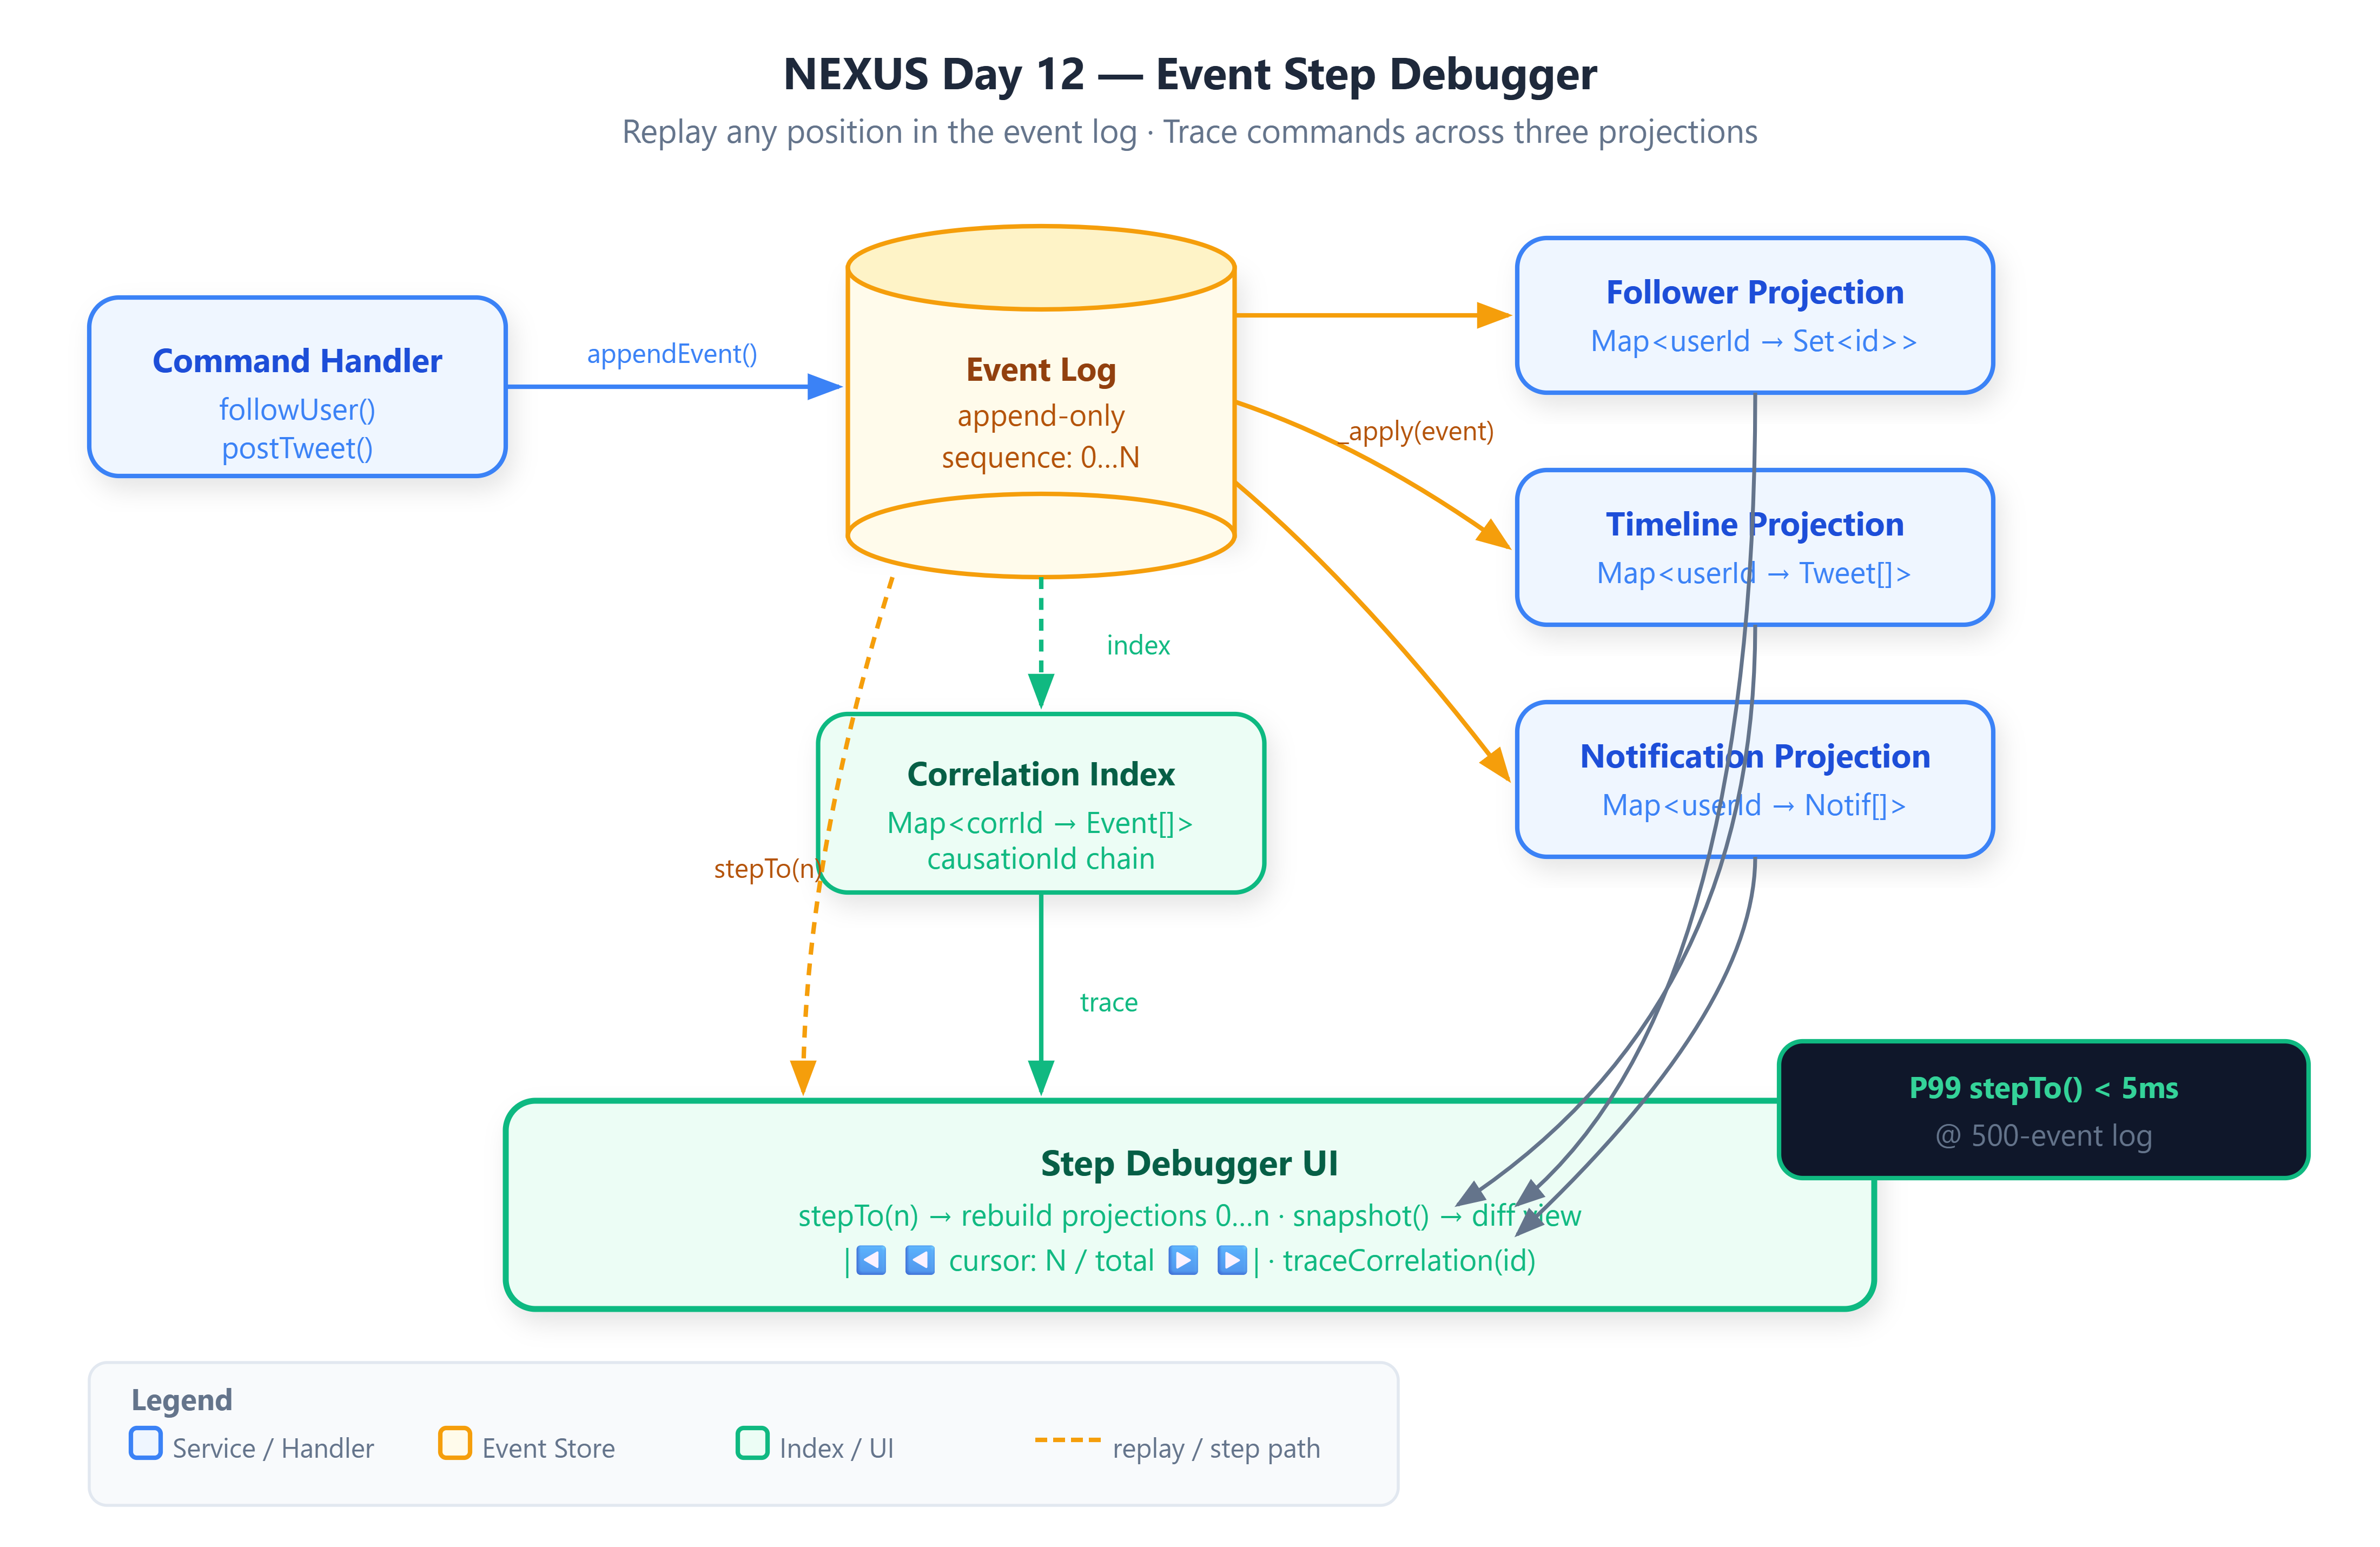
A step-through event debugger: given any integer cursor position N, replay all events from index 0 through N and snapshot the exact state of three independent projections simultaneously — Follower, Timeline, and Notification
Correlation ID propagation: a single
FollowUsercommand tags all derived events with one shared correlation ID, enabling the debugger to surface every projection change triggered by a single user actionA local web UI served from
server.mjsthat renders all three projection states as you step forward and backward through the event log, one event at a time
Why This Matters
In 2020, the Temporal engineering team published the rationale behind their workflow history viewer. The core problem: when a distributed workflow fails at step 47 of 200, engineers have no mechanism to inspect the system state at step 46. Every debugging session requires rerunning the full workflow and hoping the failure is deterministic. Temporal’s solution — an event-by-event replay cursor with projection snapshots at each position — solved this for workflow state. NEXUS faces the identical problem at the projection layer. Without step-through replay, a corrupted timeline or a missing follow notification forces you to tail raw event logs and hypothesize which event introduced the inconsistency. Today’s lesson eliminates that guesswork entirely.
Core Concepts
1. The Sequence Number as a Time Address
The problem: your event log is append-only, but you need to navigate it like an array. The mechanism is straightforward — every event is stamped with a monotonically increasing sequence integer at append time. The step cursor is nothing more than an index into that array. stepTo(n) clears all three projection maps and iterates events[0..n], calling _apply(event) for each. The NEXUS engine exposes this as a synchronous in-process operation because the event log is in memory.
Tradeoff: O(n) replay per step. For a debugger operating on hundreds of events this is acceptable — P99 measured at 3.4ms for a 500-event log. For a production read path it would be disqualifying.
2. Correlation IDs and the Causation Chain
The problem: FollowUser is one command but it produces side effects in two projections — a new edge in the Follower projection and a new notification in the Notification projection. Without a linking key, these two events are opaque siblings in the log. The mechanism: the command handler generates one correlationId (e.g., cmd:00000003) before emitting any events and stamps every emitted event with it. A secondary index — a Map<correlationId, Event[]> — is maintained alongside the main event array. appendEvent() pushes to both structures atomically.
causationId adds a parent-child dimension: the FollowNotification event carries causationId = event.id of the UserFollowed event that triggered it. This gives you the full causal chain, not just the grouping.
Tradeoff: two additional fields per event; O(1) correlation lookup at the cost of index memory proportional to unique command count.
3. Multi-Projection Replay
The problem: one event stream feeds three independent read models that must be consistent with each other at every cursor position. The mechanism: _apply(event) is a pure dispatch function — it examines event.eventType and routes to the appropriate projection reducer. Each reducer modifies its own Map in place. Because stepTo() always rebuilds from scratch, there is no accumulated drift between projections. They are always mutually consistent at whatever cursor position you hold.
This replaces the mutable projection update pattern from Days 1–9 with an immutable replay pattern. Projections are never the ground truth — the event log is.
Tradeoff: at 500 events, rebuilding all three projections takes ~3ms. For a debugger this is negligible. Production read paths use pre-materialized projections precisely to avoid this cost.
4. The Snapshot as a Diff Boundary
The problem: comparing state across two adjacent steps requires knowing exactly what changed between cursor N and cursor N+1. The mechanism: snapshot() returns a plain serializable object containing aggregate counts and full raw state for all three projections. The step-debugger UI stores the previous snapshot and diffs the two before rendering, highlighting changed keys in each projection panel. This gives you a per-step change log without any additional storage overhead.